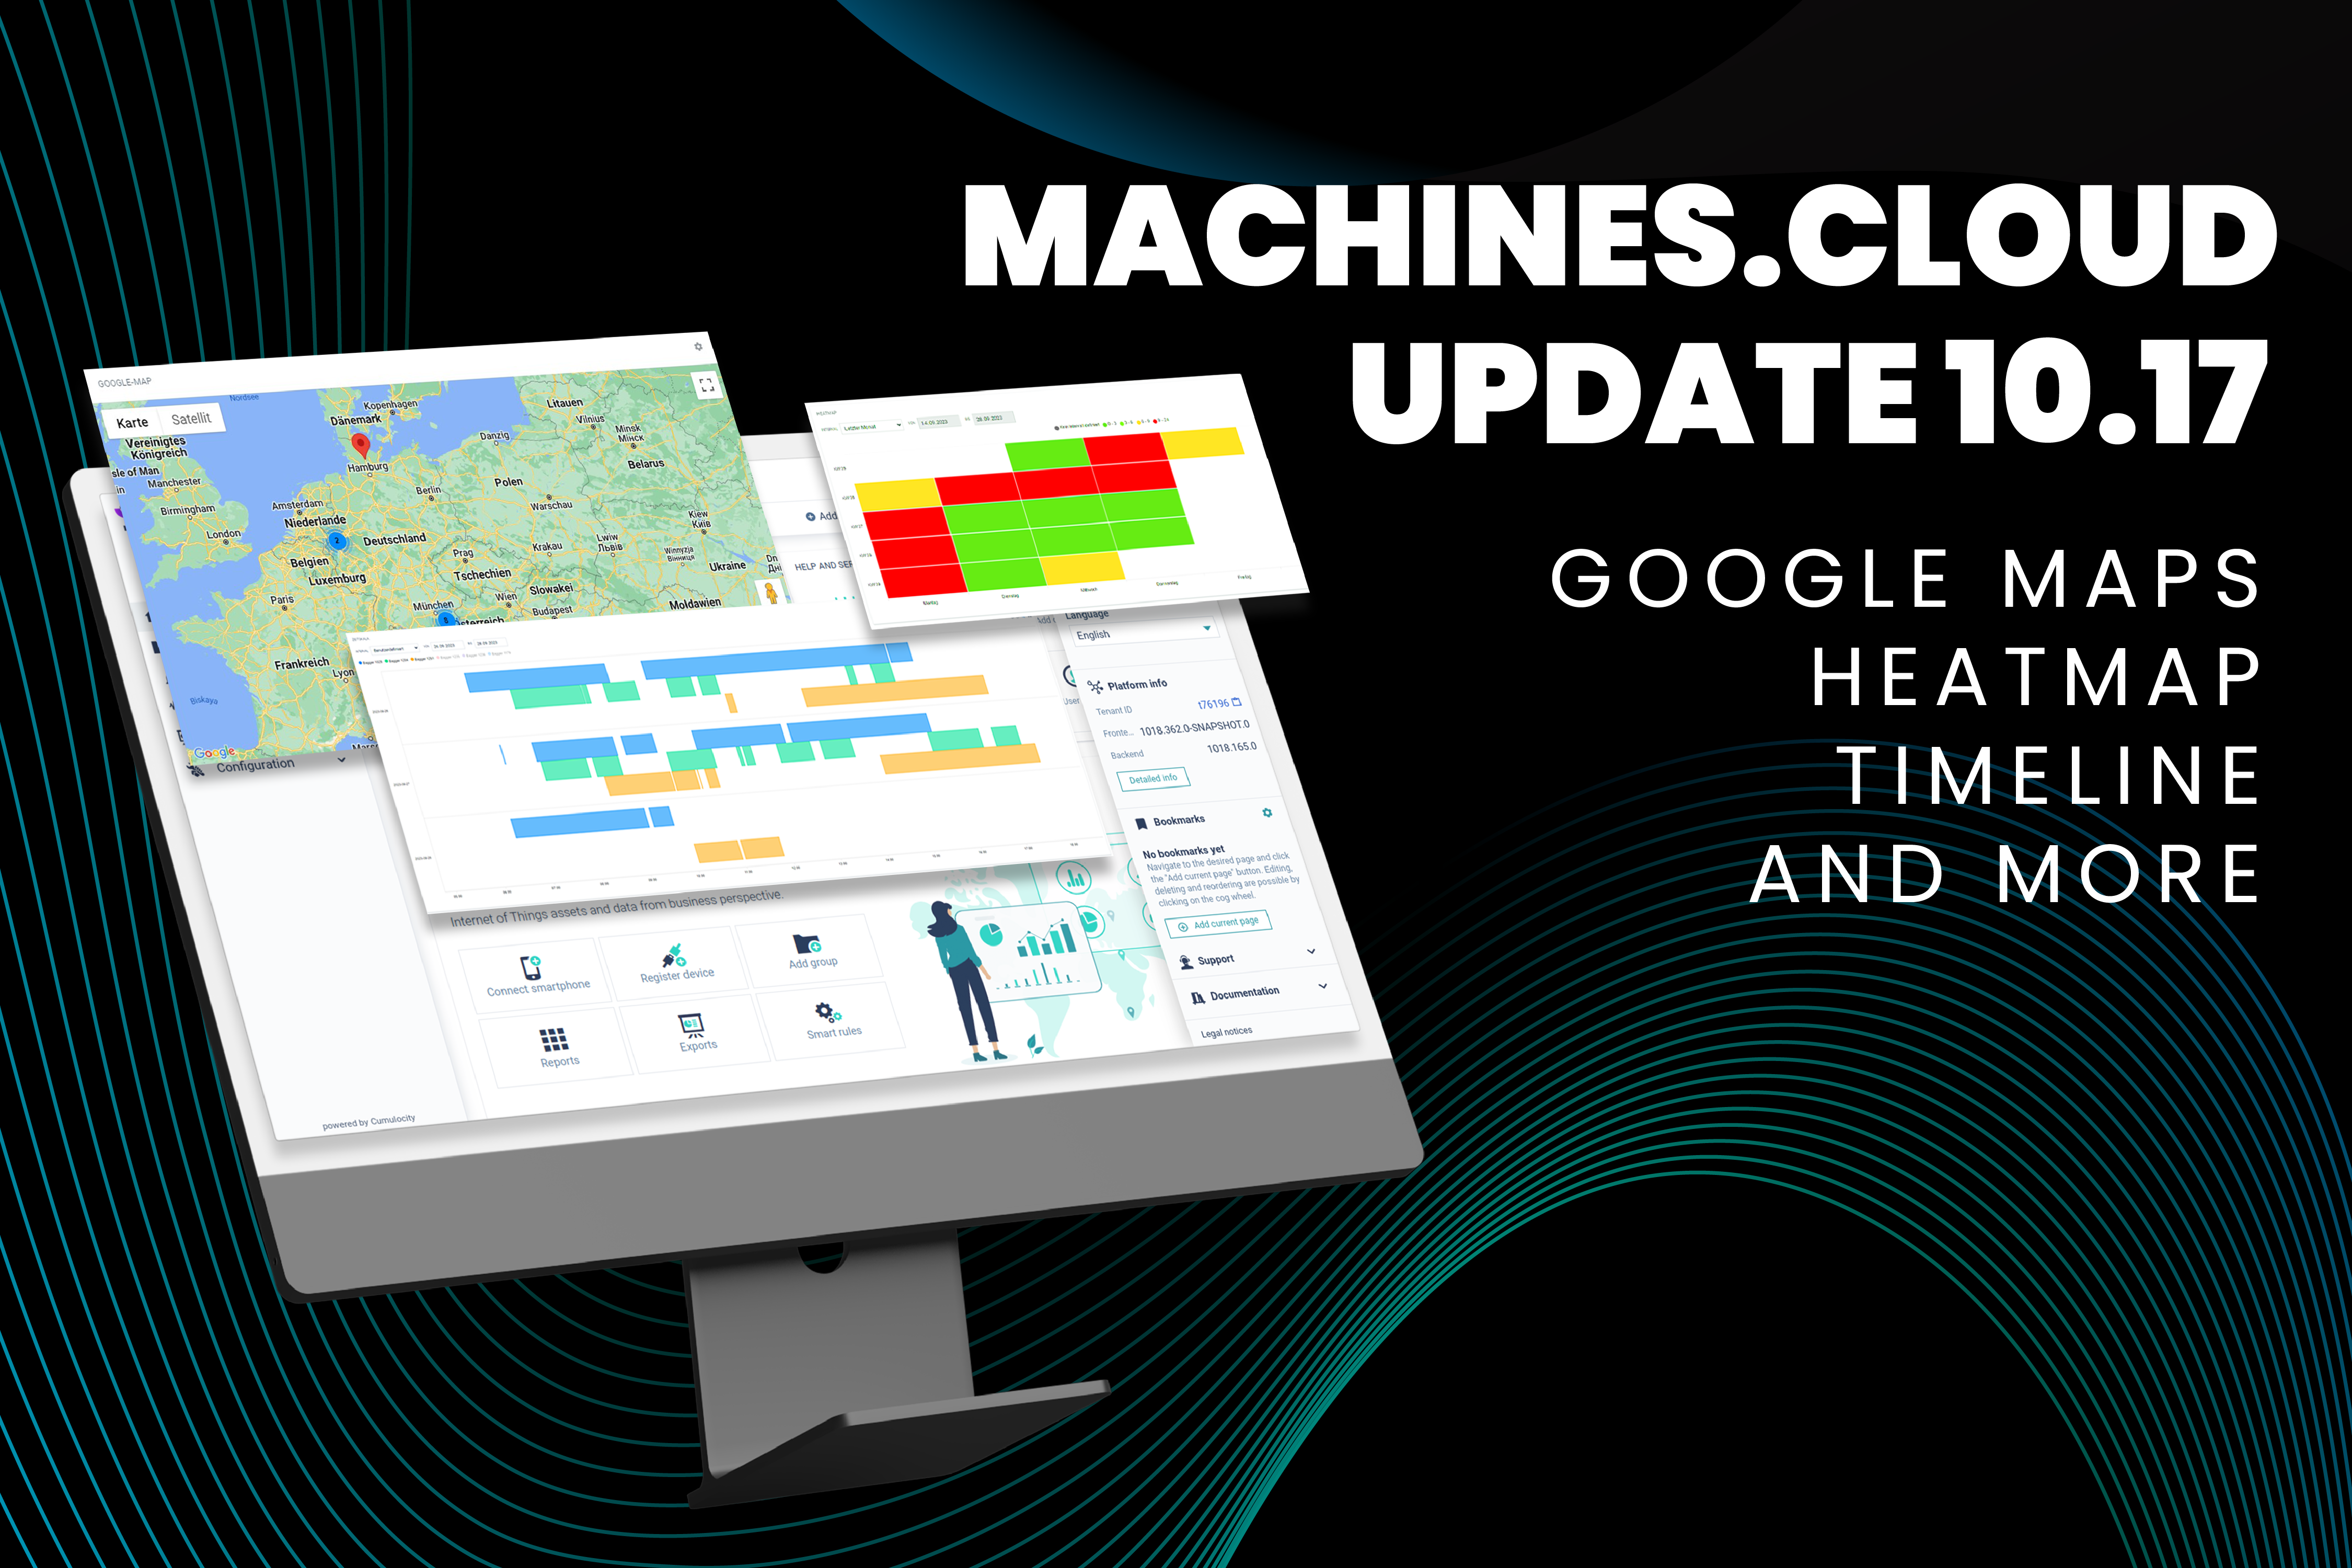
Our MACHINES.CLOUD has received an exciting upgrade that will help you optimize the use of your cloud resources. With this move, we're taking your cloud experience to a whole new level.
The usage statistics: A detailed overview of your activities
Our new menu item allows you to evaluate all your activities even better. Whether it's device management, memory usage or API requests - the new feature brings clarity to your consumption data and allows you to manage your resources more efficiently.
Real-time monitoring through interactive graphs
The usage statistics present the key figures in the form of interactive graphs. This visual representation gives you instant insight into key aspects of your cloud usage:
Device management: See at a glance how many devices are registered in your cloud.
Memory usage: Evaluate the memory space used and identify potential for savings.
API requests: Get detailed insights into the traffic generated by your devices
Insight into your monthly cloud licensing statement
The visualized data in the usage statistics is the key to your monthly cloud license billing. Never before has it been so easy to track your billing in detail. Usage statistics provide a transparent overview of your cloud usage, so you can easily track down the data originators.
Deep understanding of your API requests
Understand your API requests better than ever before! Usage statistics allow you to not miss important information about outbound events, alarms, and metrics. This comprehensive understanding helps you make the most of your cloud resources while maintaining the quality of your services.
Detailed insights and ability to act
The upgrade includes much more! Users can zoom into the graphs to analyze suspicious rashes in detail. The handy spreadsheet provides all the details used to create the graphs. These can be filtered and sorted as needed to get exactly the information you need.
Overview of groups and devices
The "Groups" and "Device" tabs provide you with a detailed overview of how your groups and devices are using the cloud resources. This allows you to optimize your cloud strategy and deploy resources in a targeted manner to ensure efficient use.
Data export made easy
Your data, your decision! We want you to be able to use your data according to your needs. That's why we've made it easy to export graphs as .png, .svg or even .csv files. You have the freedom to save the data in your preferred format.


